

Draftmetrics
The NFL's Minor League - Reviewing the colleges

Welcome to Draftmetrics brought to you by Sports Illustrated and Neil Stratton.
In today’s email:
Quantitative analyst Anthony Villiotti explores the NFL's minor league as he reviews the colleges.
Draftmetrics - Reviewing the colleges Part 2
Have a question about Draftmetrics? Email me


In Part I, the dominance of a group of 31 colleges (the Group) in supplying talent to the NFL was discussed. As pointed out in that article, these teams accounted for over half of all draft selections and were especially prevalent in the earlier rounds of the draft.
79% of selections in the first 20 picks of the first round were from the Group.
65% of selections in the rest of the first round were from the Group.
60% of selections in the second round were from the Group.
Our analysis indicates, though, that compared to projected outcomes based on an algorithm, the Group’s performance was slightly worse than might have been expected (16 fewer Major Contributors and 14 fewer Contributors). Major Contributors (MCs) are defined to be players who participated in at least 500 scrimmage snaps for at least three seasons. Contributors (Cs) are players who participated in at least 300 scrimmage snaps for at least three seasons. MCs are also included as Cs. This analysis excludes fullbacks due to their small numbers.
In this article the draft performance of each of the 31 members of the Group will be examined to isolate the source of the negative variances. The following table shows:
The number of draft selections analyzed (2012 through 2020).
The variance for both Major Contributors and Contributors,
The percentage variance for each.
The number of draft selections ranged from 77 for Alabama to 24 for three colleges. Colleges are ranked by their percentage variance for Major Contributors. Again, fullbacks are excluded due to their small numbers.
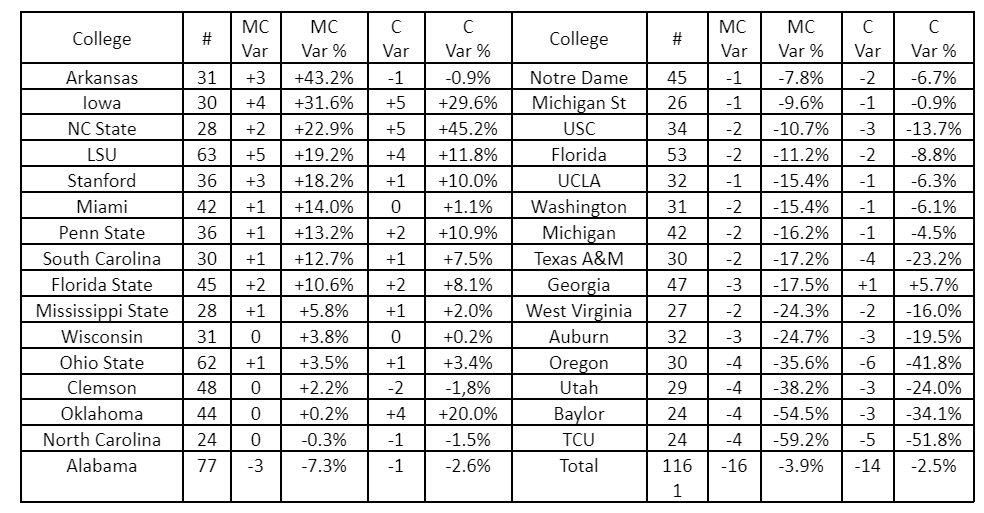
A few explanations before discussing these results. The variances for MCs and Cs are the difference between the calculated expectation and actual results. The variance percentage is calculated by dividing the variance by the expected number of MCs and Cs, respectively.
Using Miami as an example, its number of Major Contributors was 12 while the expected was 10.53, resulting in a difference of 1.47. The amount of the variance shown is “1” which is the rounding of 1.47 but the variance percentage is calculated using 1.47 as a percentage of the expected (10.53) or 13.96%, rounded to 14.0%.
Arkansas is probably not the college anyone would have expected to be at the top of the list, but they produced nine Major Contributors versus the calculated expectation of 6.28 MCs with only 31 selections. Their positive variance is attributed to the fact that Arkansas did well with their later round selections while having only two picks in the first two rounds (both of which were MCs). They had three MCs in the fourth round, and one each in the 3rd, 5th, 6th and 7th rounds. It should be noted that Arkansas had the lowest average draft position of the Group. Also worth noting is that Arkansas had a negative variance when it came to Cs. It was boom or bust for them as the number of MCs and Cs were the same.
Iowa had more early selections than Arkansas (eight of their 30 selections were in the first two rounds) and did particularly well with offensive linemen (5 of 7 were MCs), TEs (3 of 4 were MCs) and linebackers (3 of 4 were MCs). They had 15 MCs out of 30 selections. Iowa also had the second highest positive variance for Cs.
Baylor and TCU were at the bottom of the rankings, with only three draftees each out of 24 reaching Major Contributor status. The difference in their variance percentage is due to the distribution of their selections.
Here is a breakdown of performance by conference among the Group.
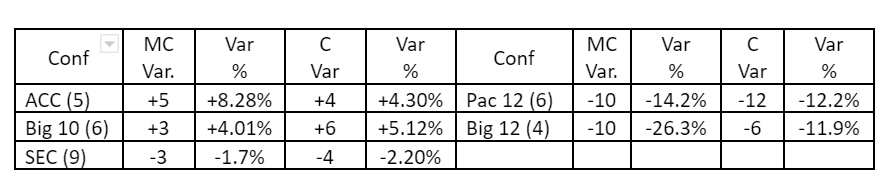
The PAC 12 and Big 12 colleges in the Group account for the entire amount of the variance, and more. Each of those conferences had one relative success (Stanford and Oklahoma) with the rest of the conference showing subpar performance.
As might be expected, the draft performance of each college varies by playing position. Results by playing position are discussed below. Because of the small number of data points, total variance and not percentages are used in the discussion.
Quarterbacks
Analyzing the variances is pretty much meaningless when it comes to QBs. Only two schools (Oklahoma and Oregon) had two or more MCs, with Oklahoma having three (Hurts, Mayfield, Murray) and Oregon with two (Hebert, Mariota). Of the other 29 members of the Group, 13 had one MC and 16 had none. Three colleges had no QBS drafted.
Running Backs
With substitution patterns and the ever-present injury threat it makes sense to look at RBs both from a Major Contributor and Contributor perspective.
Alabama had both the highest number of MCs (4) and Cs (6) and had a positive variance (+1.01 and +1.40, respectively) in both. Seven of their eight drafted RBs, most of anyone, were selected in the first three rounds of the draft. Florida State had the largest positive variance in both MCs (+1.92) and Cs (+2.09). With five draft selections they had three MCs and four Cs. Other colleges with good results at RB were Georgia, Miami and Penn State.
On the negative side of the ledger, Oregon had four RBs drafted (with three in the first four rounds) and produced no MCs or Cs, giving them a negative variance in both MCs (-0.85) and Cs (-1.64). Auburn also had four RBs drafted with no MCs or Cs, giving them negative variances of -0.84 and -1.25, respectively. Others performing below expectation were Florida and Texas A&M. Florida had six RBs drafted (with four after the fourth round) but none reached MC or C status.
LSU posted interesting results. They had the highest negative MC variance (-0.94) but among the best C variances (+0.74). LSU had six RBs drafted with four in the first two rounds. Of the four early round selections, only one reached MC status but all were Cs.
Wide Receivers
Only Major Contributors were considered in evaluating WR performance. LSU rated best in both the number of MCs produced (6) and variance (+2.90). LSU had nine receivers drafted with five in the first two rounds. Clemson was the second most productive for wide receivers with five MCs and a positive variance of +1.85. Clemson also had nine WRs drafted. Texas A&M also did well with three of their drafted receivers reaching MC status. SEC (+4 variance) and ACC schools (+2 variance) tended to do better with WRs with the rest of the Group having a -7 variance.
West Virginia was at the bottom of the ratings with a variance of -2.25. They had two WRs drafted in the first 20 selections, and six overall, but none reached MC status. Washington only had two receivers drafted but one was in the first 20 selections and the other in the second round with neither achieving MC status.
Ohio State had the most WRs drafted with 10 with seven going in the second or third round (none in the first) but only three were MCs, giving them a variance of -0.74.
Tight Ends
For TEs, both MCs and and Cs were examined. Stanford, Stanford, Stanford. Stanford led in number of draftees (7), number of MCs (5), number of Cs (also 5), MC variance (+2.82) and C variance (+1.22). Iowa also did well with 3 MCs and positive variances in both MCs (+0.88) and Cs (+0.95). Penn State had only Two TEs selected but both reached MC status.
Georgia had arguably the worst record with four TEs selected and none reaching either MC or C status. All of their selections, though, were after the third round.
Offensive Line
Only MCs were considered in evaluating OL performance. Three Big 10 schools (Michigan, Wisconsin and Ohio State) were dominant among OL. All three had seven MCs among their selections and all had positive variances. Michigan led the way with a +2.80 variance, followed by Wisconsin (+2.09) and Ohio State (+1.76). The six Big 10 schools in the Group accounted for an MC variance of +8. The rest of the Group combined had a variance of -6.
Alabama also had seven OL MCs (out of 12 draftees) but five were in the top 20 selections and they performed about as expected. Draftees from South Carolina, North Carolina State and Oklahoma also exceeded expectations.
On the negative side, Oregon had the worst variance (-2.07) with only one MC out of seven selections. USC had two MCs but a variance of -2.03. Florida State rounded out the bottom three with two MCs out of 10 draft selections and a variance of -1.67.
Defensive Line
Due to substitution patterns and the rotational nature of the position, both MCs and Cs were considered in the analysis. Alabama led the way with seven MCs and 10 Cs (out of 16 selections) and had positive variances in both MCs (+1.08) and Cs (+0.98). Arkansas had the highest positive variance (+1.41) with three MCs out of eight selections, six of which were after the third round. Mississippi State had the second highest positive variance at +1.21, with four MCs out of six selections. SEC colleges in the Group performed just about as expected. The remainder of the Group had a combined -8 variance.
Clemson and Ohio State had six MCs each and both posted positive variances (+1.02 for Ohio State and +0.57 for Clemson). LSU had five MCs and a +0.92 variance. North Carolina State had the highest positive C variance at +1.89. Five of their seven selections reached C status despite having only one selection in the first two rounds. NC State also had a +0.96 variance in MCs.
Michigan and Auburn did the worst of the Group. Despite 10 selections, Michigan had only one MC and three Cs. They had the worst C variance (-2.13) and third worst MC variance (-1.67). Auburn had the second lowest variance in both MCs (-1.88) and Cs (-1.86), despite having five selections in the first three rounds. Oklahoma had the worst MC variance at -2.13 but was not quite as bad with Cs posting a -0.94 variance.
Linebackers
Only MCs were considered in this evaluation. LSU, Florida and Georgia all had five MCs. Interestingly, only Georgia had a positive variance (+0.41). LSU (-1.05) had 11 LBs drafted with six in the first two rounds, so their projection was for 6.05 MCs. Florida had 12 LBs drafted with seven in the first three rounds and a -0.47 variance.
The top performers from a variance perspective were Stanford (+1.76), Florida State (+1.76) and Iowa (+1.67). Stanford and Florida State both had only five LBs drafted but three reached MC status. Iowa had only four LBs selected, but also had three reach MC.
Alabama has the most LBs drafted with 14 but only three reached MC status, despite nine being drafted in the first three rounds. They had the worst MC variance at -2.97. Michigan and Clemson also had subpar performances. Michigan produced only one MC out of seven selections with a -2.16 variance. Clemson had four LBs selected in the first two rounds but had only two MCs and a -2.01 variance.
Defensive Backs
Only MCs were considered in this evaluation. LSU had the second highest number of DBs drafted (15) and the highest number of MCs (10) and the best variance (+1.64). Alabama had the most DBs drafted, the second highest number of MCs (9) but a minor negative variance (-0.31). Ohio State had the third highest number of draft choices (13) and MCs (8); they performed exactly as expected.
Florida State had the second highest positive variance (+1.13) with six MCs out of nine selections. Seven of their nine selections were in the first three rounds. Also with good grades were Iowa, Arkansas and West Virginia.
TCU and Florida were the poorest performers with variances of -1.89 and -1.79, respectively. TCU has no MCs out of six selections with two of those selections in the first round. Florida had five MCs out of 12 selections, but eight of their 12 selections were in the first two rounds. Miami also did not do well with only one MC in nine selections with a variance of -1.39.
Final Comments
There were varying levels of difference between best and worst variances for the playing positions. Wide receivers showed the greatest difference followed by offensive line and linebackers. Quarterbacks and running backs had the narrowest ranges.
The rest of this article contains two tables that show the breakdown of selections by both draft position and playing position for each college in the Group. One somewhat interesting thing to note in the draft selections by position is that the selections for about half of the Group were evenly balanced between offense and defense while the rest showed an imbalance. Nine schools (Arkansas, Baylor, Florida, Georgia, Oklahoma, South Carolina, Stanford, Texas A&M, Wisconsin) had predominantly offensive players selected. Seven colleges (Alabama, Clemson, LSU, Mississippi State, Penn State, Utah, Washington) were predominantly defense.
Ric Serritella on Sports Illustrated
2023 NFL Draft Big Board & Position Rankings
Copyright © 2022 Anthony J Villiotti, 63 Stancey Road, Pittsburgh, PA 15220
This publication, or any part thereof, may not be reproduced or transmitted in any form or by any means, electronic or mechanical, or by photocopying, recording, storage in an information retrieval system of otherwise, without the prior written consent of Anthony J. Villiotti