

Draftmetrics - Draft Day Strategy
In past articles, historical data has been presented regarding various aspects of the draft. With the NFL draft rapidly approaching, this article will explore the use of that historical data

Welcome to an All Access Football free preview of Draftmetrics brought to you by Sports Management Worldwide
In today’s Draftmetrics email:
We explore the Use of Draft Choices and Exchanging Draft Choices.
In past articles, historical data has been presented regarding various aspects of the draft. With the NFL draft rapidly approaching, this article will explore the use of that historical data to formulate a draft day strategy. While past performance cannot always predict the future, it at least serves as a basis for projection. This article will be in two sections - - Use of Draft Choices and Exchanging Draft Choices.
Draftmetrics - Draft Day Strategy by Quantitative Analyst Anthony Villiotti
Have a question about Draftmetrics? Email me
 / Twitter")
The Official 2023 NFL Draft Bible has arrived! Please check your email.
Catered towards the die-hard draftnik, our newsletter will be bringing you even more of the names you need to know. Our in-depth scouting analysis includes background information, medical reports, stats, and more. We use a unique player rating scale, which measures each prospect's immediate impact level, potential developmental grade if a player maxes out his potential and a final projection of what type of player they will ultimately become.
“The most in-depth draft guide ever seen.” – Dick Vermeil, 2022 Pro Football HOF Inductee
*All subscribers of the All Access Football newsletter will receive a PDF copy of the 2023 NFL Draft Bible
If you did not receive it email me: ric@nfldraftbible.com
If you ordered a hard copy edition of the 2023 NFL Draft Bible, it should be arriving in the mail next week.
For international orders, please allow two weeks for delivery.
Our friends at Sports Management Worldwide have generously offered our readers a $400 discount code to Learn the Fundamentals of Football Player Development.

Stay up-to-date
You won’t have to worry about missing anything. Every new edition of the newsletter goes directly to your inbox.
Join the All Access Football Crew
Be part of a community of people who share your interests.
If you have not yet purchased, click below for our best offer:
This study by Anthony J Villiotti will:
• Put the draft into the proper perspective
• Examine the outcome of GM’s use of Draft Choices and Exchanging Draft Choices.
• Evaluate the draft performance of NFL Draft Day Strategy
• Review difference among draft years
• Comment on constructing a competitive NFL roster

In past articles, historical data has been presented regarding various aspects of the draft. With the NFL draft rapidly approaching, this article will explore the use of that historical data to formulate a draft day strategy. While past performance cannot always predict the future, it at least serves as a basis for projection. This article will be in two sections - - Use of Draft Choices and Exchanging Draft Choices.
Use of Draft Choices
I am not a proponent of the “Best Player Available” strategy. The BPA strategy works fine in baseball where most drafted players are not expected to impact a team’s success for several years. In football, though, an early draft choice is often expected to contribute from day one or shortly thereafter. In addition, our contention is that it is rare when one player is head and shoulders above the other available players, so why not select the player in the group under consideration who best fills a positional need.
Rather than proposing absolutes strategies (e.g., only select offensive linemen in the first round, etc.), the following table provides guidance regarding the point in the draft, based on outcomes from the 2012 through 2020 drafts, when it is most advisable to select specific positions. This is done by placing each playing position/draft position combinations in one of three categories:

Except where noted in the remarks following the table, the table assumes the goal is to maximize the number of Major Contributors (MCs). MCs are players who participate in at least 500 scrimmage snaps for at least three seasons.
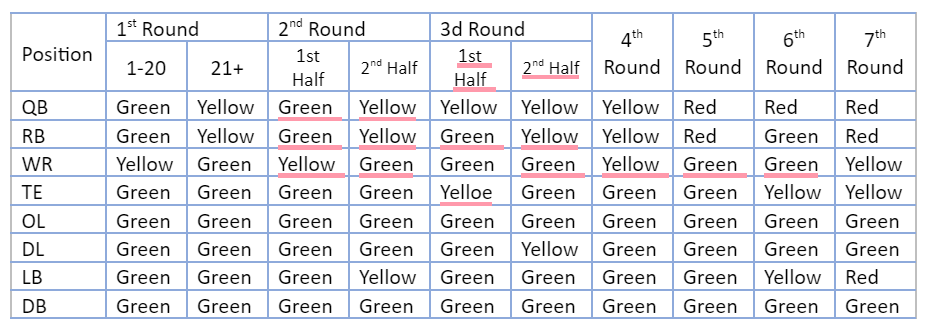
How is this table useful? When considering which position to select in a particular draft segment it can serve as a reminder of historical outcomes. For example, if your favorite team is deciding between drafting a wide receiver and an offensive lineman with the 10th selection of the draft the chart suggests that the offensive lineman is the safer selection.
Having said all that, we understand that teams will rely on their own information and assessments to decide who to draft and when. General Managers and scouting personnel earn their position by showing their acumen in identifying players who will succeed in the NFL. They will rely on their observations and “gut feeling” more than historical statistics. Hopefully, though, historical data will be part of the thought process.
Quarterbacks
Of the 29 QBs that were MCs in our study of draft outcomes from 2012 through 2020, 17 were drafted in the first 10 selections of the draft, with 20 in the first round.
Brock Purdy not withstanding, it is generally an exercise in futility to draft a QB after the fourth round. None of the 29 MCs were selected in the 5th through 7th round.
QBs have the highest percentage (18%) of drafted players who never play in an NFL game.
Suggestion: If you need a QB jump up and grab him.
Running Backs
Due to injury issues and substitution patterns, the review was extended to include Contributors (“Cs”).
Reflecting the devaluation of the position, only 13 RBs were selected in the first round during the nine-year study period; these early selections have largely had successful outcomes.
About twice as many RBs were selected in the second round.
51 of the 62 Cs were selected in the first four rounds.
RBs had the lowest percentage (33%) of draft selections who went on to achieve C status.
Suggestion: Do not count on drafting a successful running back in the later rounds.
Wide Receivers
WRs are the riskiest first round selection, with only 22 of 35 (63%) becoming MCs; average for all positions was 75%.
Only six of 44 fourth round selections became MCs; the average for all positions was 25%.
More MCs were selected in the 6th round than the 5th round (11 vs 6) .
Suggestion: Look for receivers in the middle rounds but ignore the first half of the third round.
Tight Ends
Due to substitution patterns, the review was extended to include Cs.
As with RBs, TEs are lightly drafted in the first round (eight in nine study years) due to the lower value placed on the position but are mostly successful.
Late round selections did not work; only 4 Cs out of 38 selections in the final two rounds.
Suggestion: Look for TEs either early or in the middle rounds
.
Offensive Line
Regardless of the round, OL are always the safest selection.
A higher percentage (42%) of OL achieve MC status than any other position.
OL account for 35% of the MCs drafted in the 6th and 7th rounds.
6th round OL have a higher success rate than 5th round OL.
Suggestion: Take an OL at any point in the draft.
Defensive Line
Due to substitution patterns, the review for DL was extended to include Cs.
More DL (54) were drafted in the first round than any other playing position.
Late 3rd round DL have tended to underperform.
When Cs are included, 4th round DLs have had the best results of all playing positions.
Suggestion: Take DL either early or after the 3rd round.
Linebackers
4th and 5th round LBs tended to have better results than other playing positions.
LBs had the lowest percentage of Cs (36%) than any other defensive position.
51 LBs were selected in the 7th round but none became MCs.
Suggestion: Don’t take a LB after the 5th round.
Defensive Backs
More DBs are drafted than any other position,
Much of that occurs in the final two rounds of the draft, where 141 DBs were taken, about 30 more than the next closest position.
DBs are the second least risky selection across the draft, trailing only OL.
A higher percentage (94.3%) of drafted DBs played in NFL games than any other playing position.
Suggestion: DBs are a safe choice throughout the draft.
Exchanging Draft Choices
Of the 259 draft selections in the 2023 draft, 69 draft positions are already affected by trades and there will certainly be more trades throughout the draft. The main topic in this discussion is whether a team should trade down and accumulate additional choices or trade up for earlier selections. Typically, a trade-up occurs for either of two reasons:
A team sees a run on a position of need and wants to move up so they are nor shut out.
A team has a player they really like and will pay the price to be in a position to draft him.
There is a price to be paid for moving up. If a team is going to move down in the draft, even if there is no difference in the probability of a successful outcome, they expect to be compensated for making the move. A value chart, or point system, that is attributed to Jimmy Johnson and the Cowboys has become the generally accepted way to determine fair trade values.
The following table lists each trade affecting first round selections during 2020, 2021 and 2022 that were “pure” move-ups (i.e., no players involved). The table includes (1) the year (2) a description of the trade, (3) the player selected with the higher draft choice acquired, (4) a comparison of value surrendered and received by the participating teams under the Johnson system and (5) the equivalent number of MCs surrendered and acquired in each trade and the premium involved. There is no premium built into the expected MCs, so it is calculated in the table.

As reported in a 2022 Washington Post article by Sam Fortier, the so-called Johnson trade chart was actually developed for the Cowboys in 1991 by a petroleum engineer (who was an acquaintance of owner Jimmy Jones) based on historical trade information. There have been several alternative charts proposed over the years and some are in use by NFL teams. The Johnson chart, though, has largely survived the test of time and is the most commonly cited chart. While far from perfect, it does offer a baseline for discussing trades. Since it is based on historical trades, the chart includes the premiums that teams paid for moving up. That premium, of course, is the incentive for teams to move down. The MC comparisons are included to provide a more analytical perspective and an indication of the premium paid in trades, which cannot be determined in the point system.
Three trades had the largest premium for both the point system and a comparison of MCs. Two of three were the results of teams moving up to draft a QB; Justin Fields by the Bears and Trey Lance by the 49ers. Moving up for a QB can make strategic sense due to QB being a “premium” position.
The other trade is a little puzzling and had the Saints moving from the 18th selection to the 16th selection, which they subsequently traded to move up to number 11 (and take WR Chris Olave. Philadelphia traded two first-round selections (16th and 19th overall) and a sixth-round selection (194th overall) to New Orleans in exchange for first-, third- and seventh-round selections (18th, 101st and 237th overall) as well as a 2023 first-round selection and a 2024 second-round. The Saints used the 19th pick to select OL Trevor Penning. It is not clear if this trade was part of the strategy to move up and take Olave but for purposes of this article it is assumed that was the case.
A common denominator in all three trades is that future year draft selections were involved. In the 2021 trade to move up and take Trey Lance, the 49ers surrendered first round choices in both 2022 and 2023. In the 2021 trade to move up to take Justin Field, the Bears gave up their 2002 first round choice. The 2022 trade by the Saints was already described. What this may show is that teams assign a lower value on selections in a future year. It is also possible that they overestimate how early the future selection will be. In the Fields trade, the 2022 selection turned out to be the seventh in the draft, which the Giants used to take OL Evan Neal. It is doubtful that the Bears expected the selection they surrendered to be so high.
So, trade up or trade down? It appears that the team trading down tends to have the probabilities on their side. A 2012 academic study by Cade Massey and Richard Thaler tends to support this proposition. There are two quotes in that study that are worth noting:
“In paying a steep price to trade up, teams are paying a lot to acquire a pick that is worth less than the ones they are giving up.”
“The more information teams acquire about players, the more overconfident they will feel about their ability to make fine distinctions.”
Looking only at probabilities, the numbers are weighted in favor of teams trading down. What this does not consider, though, is the strategic value of trading up to take a player at a premium position. It is interesting that of the 17 trades cited in the above table (the 17th trade ended in the trading of the selection), six were used to move up to take a WR and only three for QBs. WRs had the lowest percentage of first rounds MCs of any position. Time will tell who had the advantage in these trades.
Regarding premiums, the trades resulted in the equivalent of 9.4 MCs being transferred from the teams trading up to the teams trading down. There is no standard that can be applied to premiums. The amount of the premium is a function of two things - - how badly a team wants to move up and whether teams are competing to move up. This makes it a case-by-case evaluation with solid reasons to go either way. If a team has a need at QB it clearly makes sense to trade up and pay the price. This can be true of other positions as well if there is a shortage at that position. On the other hand, gathering more draft choices is also a good strategy. This is a wishy-washy conclusion, but it truly is a case-by-case situation.
Tony


The 6th Annual ITL Best NFL Draft Award
The Best Draft Award is presented to the NFL organization determined to have selected the most impactful rookie draft class, as chosen by their front office peers.

The winner of the 2022 Best NFL Draft Award goes to John Schneider and the Seattle Seahawks. With quarterback Russell Wilson no longer the face of the franchise, the Seahawks entered the 2022 season with lots of question marks. They needed to retool, and a key part of success would mean adding critical pieces in the draft. Mission accomplished. With their first-round selection, they found a starter at the critical left tackle position in Mississippi State’s Charles Cross.
In the second round, they found a 1,000-yard rusher in Michigan State’s Kenneth Walker and in the third round, they selected a bookend tackle in Washington State’s Abraham Lucas. Cross started 17 games, Lucas started 16, and Walker 11, but that wasn’t all. The team also got multiple starts out of Cincinnati cornerback Coby Bryant, a fourth-round pick, and UTSA corner Tariq Woolen, a fifth-rounder who started 17 games.
Both Walker and Woolen were named to the Pro Football Writers Association All-Rookie team, as Seattle finished 9-8 and clinched a berth in the wildcard round of the playoffs. Congratulations to the Seahawks!
All-Time Award Winners
2022 – John Schenider, Seattle Seahawks
2021 – George Paton, Denver Broncos
2020 – Jason Licht, Tampa Bay Buccaneers
2019 – John Lynch, San Francisco 49ers
2018 – Chris Ballard, Indianapolis Colts
2017 – Jeff Ireland, New Orleans Saints
Copyright © 2023 Anthony J Villiotti, 63 Stancey Road, Pittsburgh, PA 15220
This publication, or any part thereof, may not be reproduced or transmitted in any form or by any means, electronic or mechanical, or by photocopying, recording, storage in an information retrieval system of otherwise, without the prior written consent of Anthony J. Villiotti