

NFL Draft pick trade value chart: How Geep Chryst, Jimmy Johnson, and Rich Hill shaped the way that teams evaluate draft picks in trades
NFL Draft pick value chart here are some takeaways.

Welcome to All Access Football!
The National Football League Draft Countdown now stands at 3 days until we reach our destination: Kansas City!
In today’s email:
The Interactive 2023 NFL Trade Value Chart by Draftek.com
Geep Chryst is credited with developing the original Draft Value Chart in 1993.
Jacob Camenker on How Jimmy Johnson and Rich Hill shaped the way that teams evaluate draft picks in trades
The Jimmy Jonson trade value chart

The Rich Hill draft pick trade value chart
Registration for the Baldy and Ric Day 2 Private Zoom here and get 50% of AAF forever

The DraftTek Interactive Trade Value Chart and the Classic Jimmy Johnson Valuation Model
NFL teams use trade value charts when planning draft day trades. Enter your team in the box below, and all the picks for your team will be highlighted in green.
Teams are reported to use a revised trade value model in recent years, as discussed by Bill Belichick. Drafttek provides an alternate trade value model, developed by Rich Hill of Pats Pulpit, which we believe more accurately reflect the trades of the past several years:
The Interactive Draftek feature that allows you to sort draft capital by team.
Example: DET Draft Capital : 3539.8

Geep Chryst is credited with developing the original Draft Value Chart
George Patrick "Geep" Chryst (born June 25, 1962) is an American football coach, most recently serving as the tight ends coach for the California Golden Bears. Chryst has 25 years of NFL coaching experience, working as an offensive coordinator, quarterbacks coach and tight ends coach. In 13 of the 25 seasons coaching in the NFL his offense ranked in the Top Ten in either Rushing, Passing or Points Scored.
In 1993. Chicago Bears head coach Dave Wannstedt had replaced Mike Ditka and wanted a chart that would mimic the philosophy that Jimmy Johnson was implementing in Dallas, where Wannstedt was his defensive coordinator. The chart was used on draft day by a handful of teams who kept it hidden from others to create value for the trading of draft picks. Wannstedt shared the chart back to Johnson, but others made copies and it worked its way throughout the league.
Watch Ric’s interview from October 2020 with Geep Chryst on YouTube
NFL Draft pick trade value chart: How Jimmy Johnson, Rich Hill shaped the way that teams evaluate draft picks in trades

The NFL hasn't always been a trade-happy league, but we have seen quite a few deals during the 2022 offseason. Several big-name quarterbacks including Russell Wilson, Matt Ryan and Deshaun Watson have been traded and eight teams in the NFL now have multiple first-round picks.
Those teams now have a lot of buying power in the 2022 NFL Draft. They will be able to move up and down the board as they please while also setting themselves up to add assets during the 2023 NFL Draft if all goes well.
That said, NFL fans may wonder exactly how these teams evaluate draft picks when making a trade. After all, teams don't know who will be on the board at certain junctures in the draft, so how can they properly assess the worth of a pick?
Over the years, the NFL has figured out a way to determine the value of a draft pick. Some of the sport's brightest minds have created charts that assess what each pick is worth. Some were founded arbitrarily while others approached the problem more analytically, but at this point, every NFL team has a trade value chart.
That doesn't mean that they are all the same. In fact, they vary from team to team. But generally, all teams are in the same ballpark when discussing draft pick value, and that's thanks to the charts that were pioneered by Jimmy Johnson.
Below is a look at Johnson's original draft value chart as well as a more recently-created chart that uses a more analytical approach to the valuation than Johnson's.
NFL Draft pick trade value chart: Jimmy Johnson
The original NFL Draft value chart was created by Jimmy Johnson during his time with the Cowboys in the early 1990s. The idea was simple. He wanted to assign numerical values to each draft pick as a way to evaluate the worth of picks for potential trades.
So, Johnson created the draft value trade chart by giving the first pick in the draft the highest value at 3,000 points. Each pick after that decreased in value. This chart gave the Cowboys a competitive advantage when making trades in the early stages of its use, but eventually, the rest of the NFL adopted it.
The value chart changes slightly from year to year because of the varying number of compensatory picks tacked on to each round beginning in the third and beyond. Here's a look at how the values shake out for the 2022 NFL Draft, per Drafttek.com.
NFL Draft pick trade value chart: Rich Hill
Though Johnson's draft value chart was the first of its kind, it is no longer the be-all, end-all for NFL teams. Part of the reason for that is the fact that Johnson somewhat arbitrarily created the values in his initial chart. His concept was strong, but he had more limited access to statistical information and historical trends than NFL teams have now. So, he had to ballpark it a bit more.
In recent years, analytics have become far more common in the NFL, so it stands to reason that teams have done a thorough analysis of the trade value chart to find its shortcomings. That has changed the overall value of each pick as well.
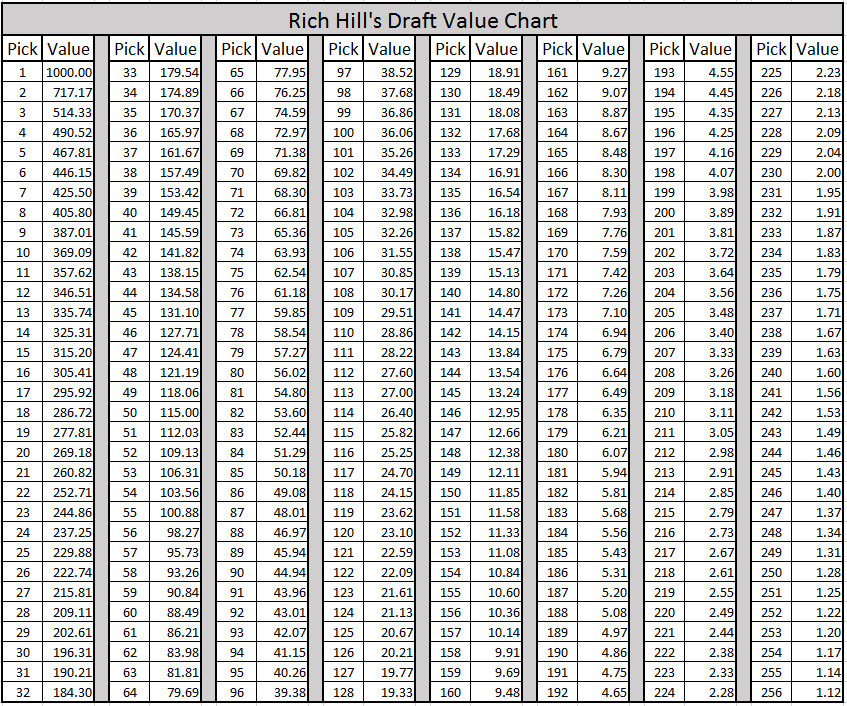
The trade value charts from team to team are similar, but they are not one size fits all. That said, Rich Hill of Pats Pulpit created a draft pick value chart that many believe more accurately reflects the current value of draft picks in the NFL compared to Johnson's.
Below is a look at Hill's model for 2022, which begins by assigning the No. 1 pick 1,000 points instead of 3,000.
Follow Jacob Camenker on Twitter
Rich Hill on draft capital value

There is an old chart floating around that is attributed to former Cowboys and Dolphins head coach Jimmy Johnson and teams consult some variation of the end result when conducting trades involving draft picks.
The chart predates the new Collective Bargaining Agreement (CBA) and it’s time to update the numbers based on actual trades that have taken place.
Since the 2012 NFL Draft- the first one after the new CBA- there have been 124 trades that involve only draft picks. Trades that involve a player- like the New England Patriots trading a sixth round pick to the Tennessee Titans for EDGE Akeem Ayers and a seventh round pick- are not factored into my calculations, but can be evaluated to understand the perceived value of the player.
Based on these pick-for-pick trades, I’ve created the following draft value chart to show how teams actually value draft picks.
Here are some takeaways.
Trades at the top of the draft are all ad hoc
Trying to create a table that includes picks at the top of the draft (ie: top five) doesn’t make sense because the value of the pick changes on a year-to-year basis. For example, the #1 pick when Andrew Luck was a prospect is worth a lot more than the #1 pick this year, with Myles Garrett as the top prospect.
Teams love their quarterbacks and drafts with good quarterback prospects see an increased value in picks at the top. So take the value of the top five picks on the chart as a baseline, and adjust the value accordingly when top prospects come out of college.
Future draft picks are valued one round earlier than the current year
In other words, a team could trade a fourth round pick in 2017 and reasonably expect to receive a 2018 third round pick on the market. A current fifth is worth a future fourth. No one really wants future seventh round picks because they hold almost no value.
This valuation of future picks is a representation of time value of money, which means that a draft pick now is worth more than the same draft pick in a future year.
Creating a brand new NFL Draft Value Trade Chart
